Build a dashboard that shows what you care about
Add visuals, set what each one shows, arrange them, and keep more than one dashboard for different jobs.
Your dashboard is the first thing you see when you open Worthberry, so it should answer the questions you actually ask. How much have I spent this fortnight? Am I on track with my budgets? Is my net worth going up? It starts with a sensible layout, and everything on it can be swapped, resized, moved or removed.
This guide walks through customising your dashboard, choosing and setting up visuals, and keeping separate dashboards for different jobs.
1. Switch on Customise
On Dashboard, press Customise at the top right. Your visuals get a dashed outline and a small toolbar each, and a few new buttons appear:
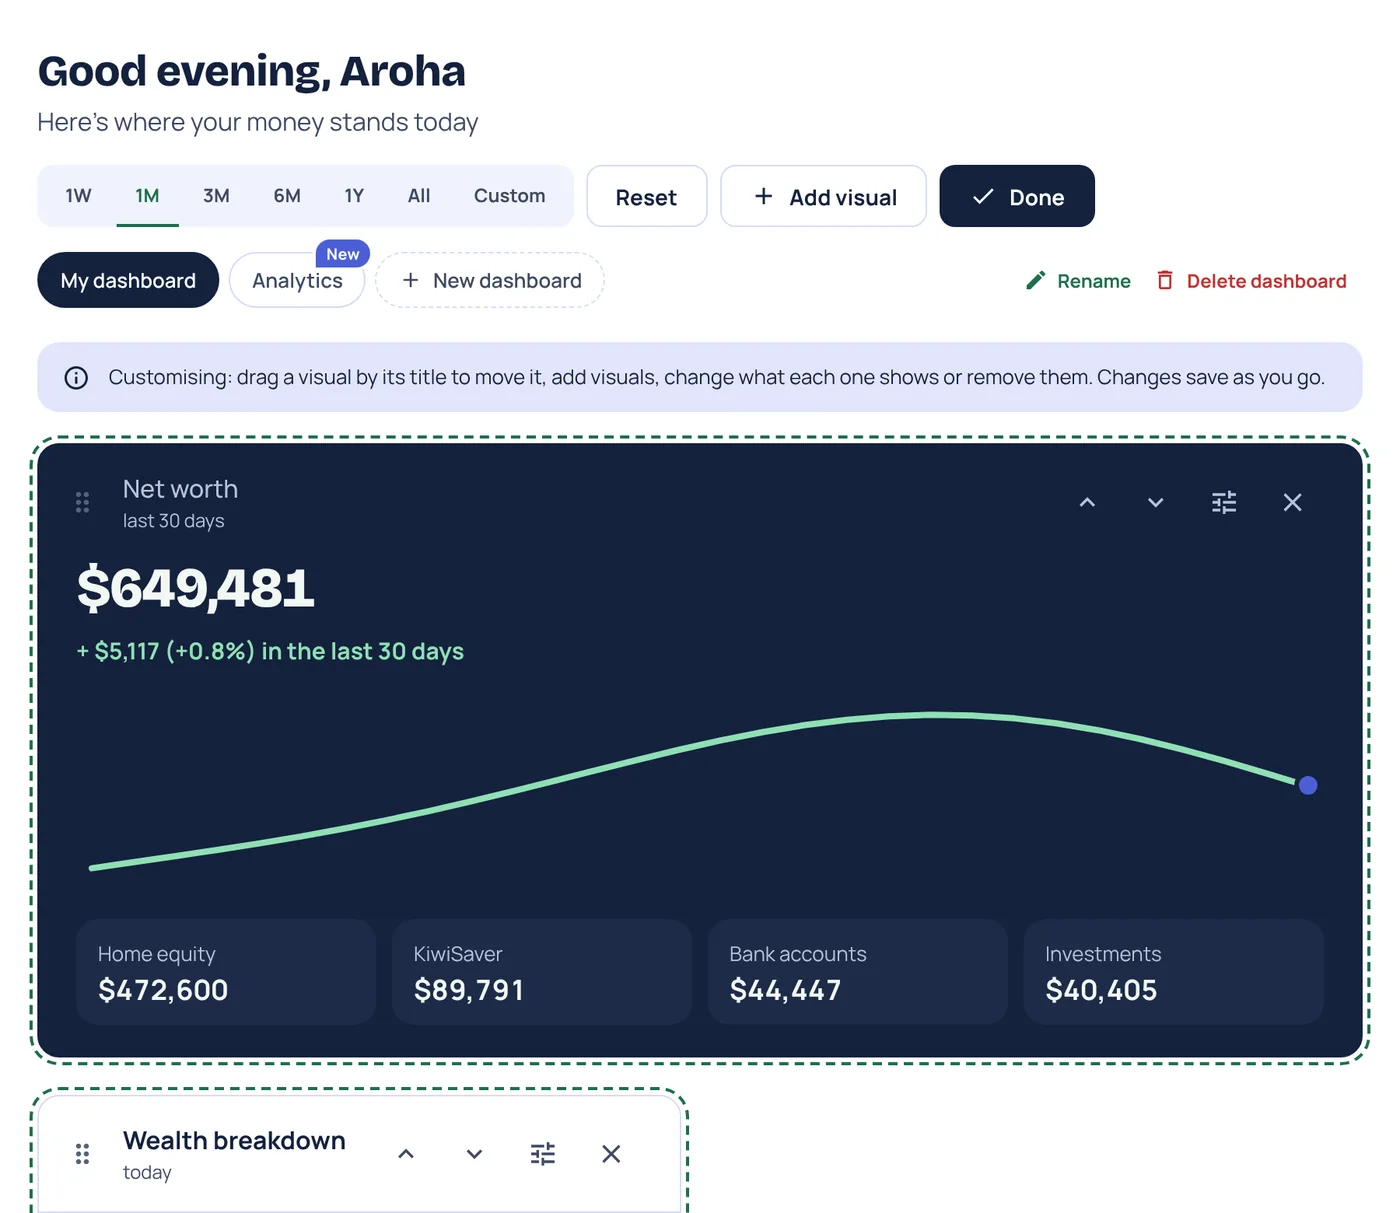
- Add visual opens the list of everything you can add.
- Done leaves Customise. There's no save button: every change saves as you go.
- Reset puts your main dashboard back to its original layout, or clears any other dashboard so you can start again.
- Rename and Delete dashboard sit next to your dashboard tabs.
Each visual's toolbar has a handle to drag it, up and down arrows to move it one place at a time, a settings button to change what it shows, and a cross to remove it.
2. Add a visual
Press Add visual, or the Add a visual tile at the end of your dashboard. You'll see 19 visuals, each with a preview and a line on what it's good for.
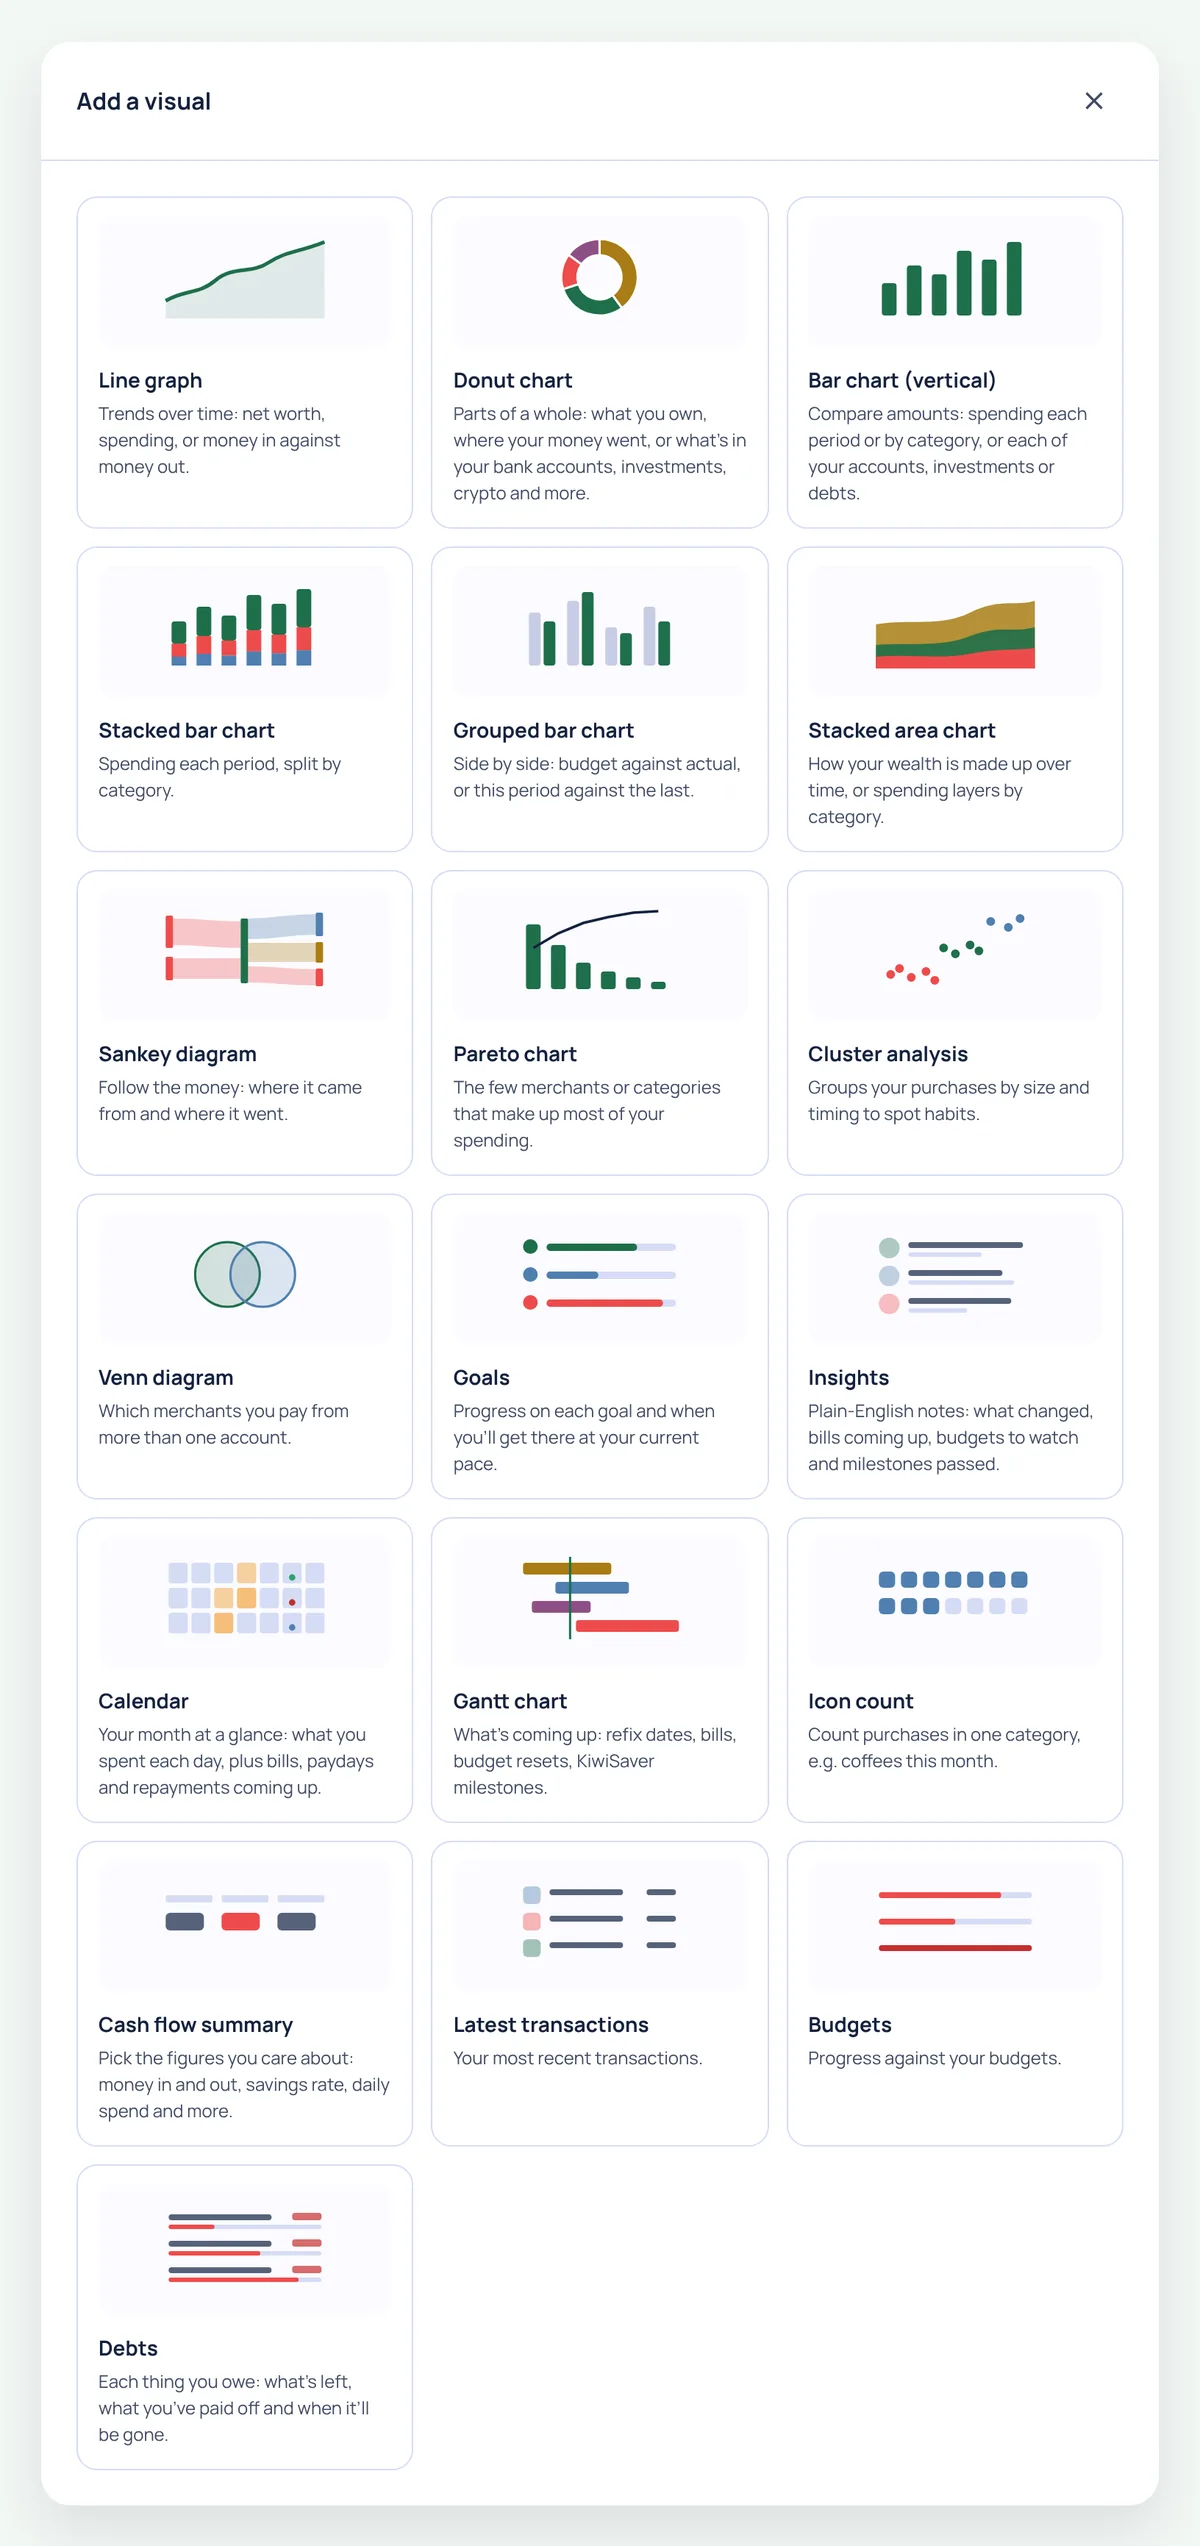
Not sure where to start? Here's what each kind is best at:
- Trends over time: Line graph for net worth, spending, or money in against money out, and Stacked area chart for how your wealth is made up over time.
- Where your money goes: Donut chart, Bar chart (vertical) and Stacked bar chart for spending by category, Pareto chart for the few merchants that make up most of it, and Sankey diagram to follow your money from pay to spending.
- Comparisons: Grouped bar chart for budget against actual, or this period against the last.
- Day to day: Cash flow summary (money in and out, savings rate, daily spend and more), Latest transactions, Calendar for what you spent each day and what's due, and Icon count, which counts purchases in one category, like coffees this month.
- Plans and progress: Budgets, Goals, Debts, Gantt chart for what's coming up (bills, budget resets, home loan refix dates and KiwiSaver milestones), and Insights for plain-English notes on what's changed.
- Habits: Cluster analysis groups purchases by size and timing, and Venn diagram shows which merchants you pay from more than one account.
3. Set up what it shows
Pick a visual and its settings open, with a live preview at the bottom so you can see the result before it goes on your dashboard.
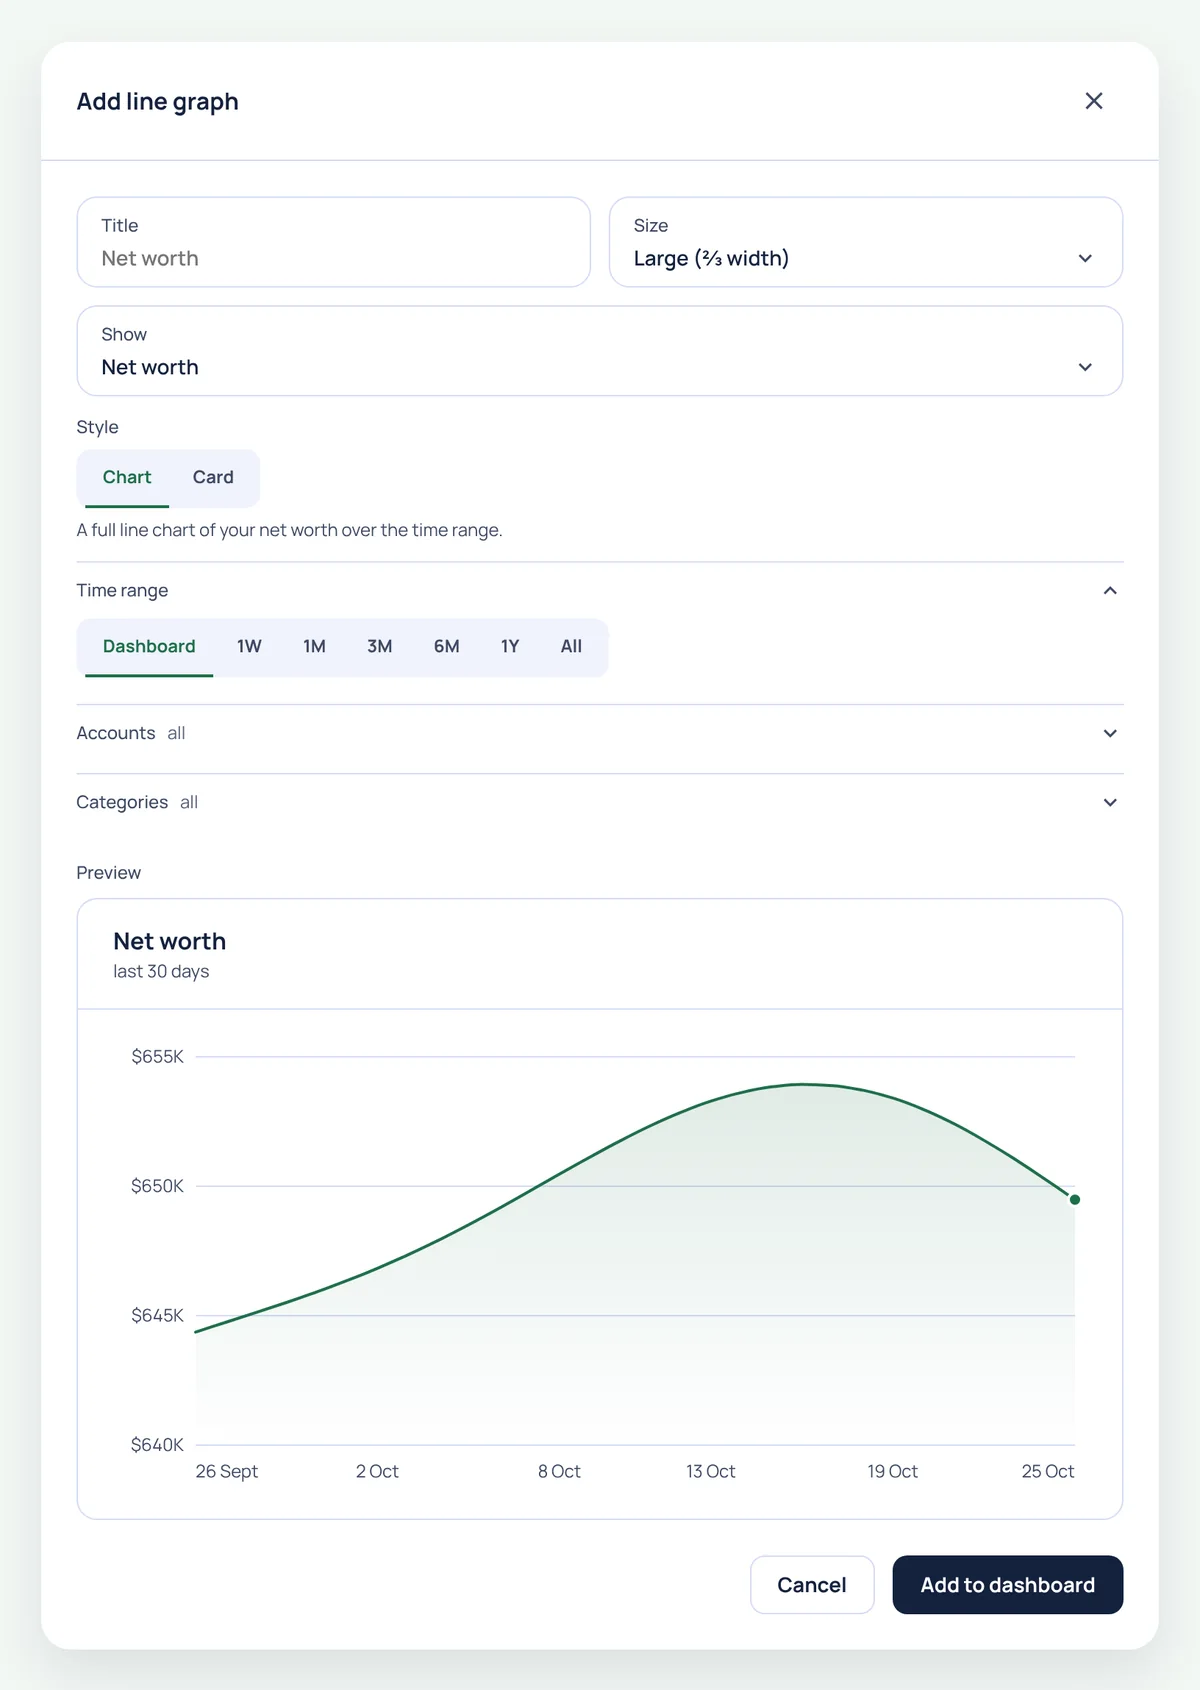
- Title: name it whatever makes sense to you, or leave it blank to use the default.
- Size: Small (⅓ width), Medium (½ width), Large (⅔ width) or Full width. Visuals in the same row line up at the same height.
- Show: for visuals that can show more than one thing, like a line graph of net worth, spending, or money in against money out.
- Time range: leave it on Dashboard to follow the range at the top of the page, or give this visual its own, from one week to all time.
- Accounts and Categories: narrow a visual down, like spending from your everyday account only, or eating out and takeaways together.
Press Add to dashboard. To change it later, press the settings button on the visual while you're in Customise.
4. Arrange it your way
- Drag a visual by its title, or its handle, to a new spot. The others make room as you go.
- Or use the up and down arrows to move it one place at a time.
- Press the cross to remove anything you don't look at. You can always add it back.
- Press Done when it looks right.
Put what you check most at the top. If budgets are your first question each morning, they belong in the first row.
5. Change the time range
The buttons at the top of your dashboard switch every visual at once between 1W, 1M, 3M, 6M, 1Y and All. Press Custom to pick your own dates, like a holiday or the time since your last payday. Visuals with their own time range keep it.
Want your dashboard to leave something out, like property or crypto? Use View at the top of the platform to choose which kinds of money your dashboard totals and visuals include. Press Show everything to bring it all back. To narrow one visual to particular accounts, use its Accounts setting instead.
6. Keep more than one dashboard
A single dashboard gets crowded. Press New dashboard next to your dashboard tabs to start another.
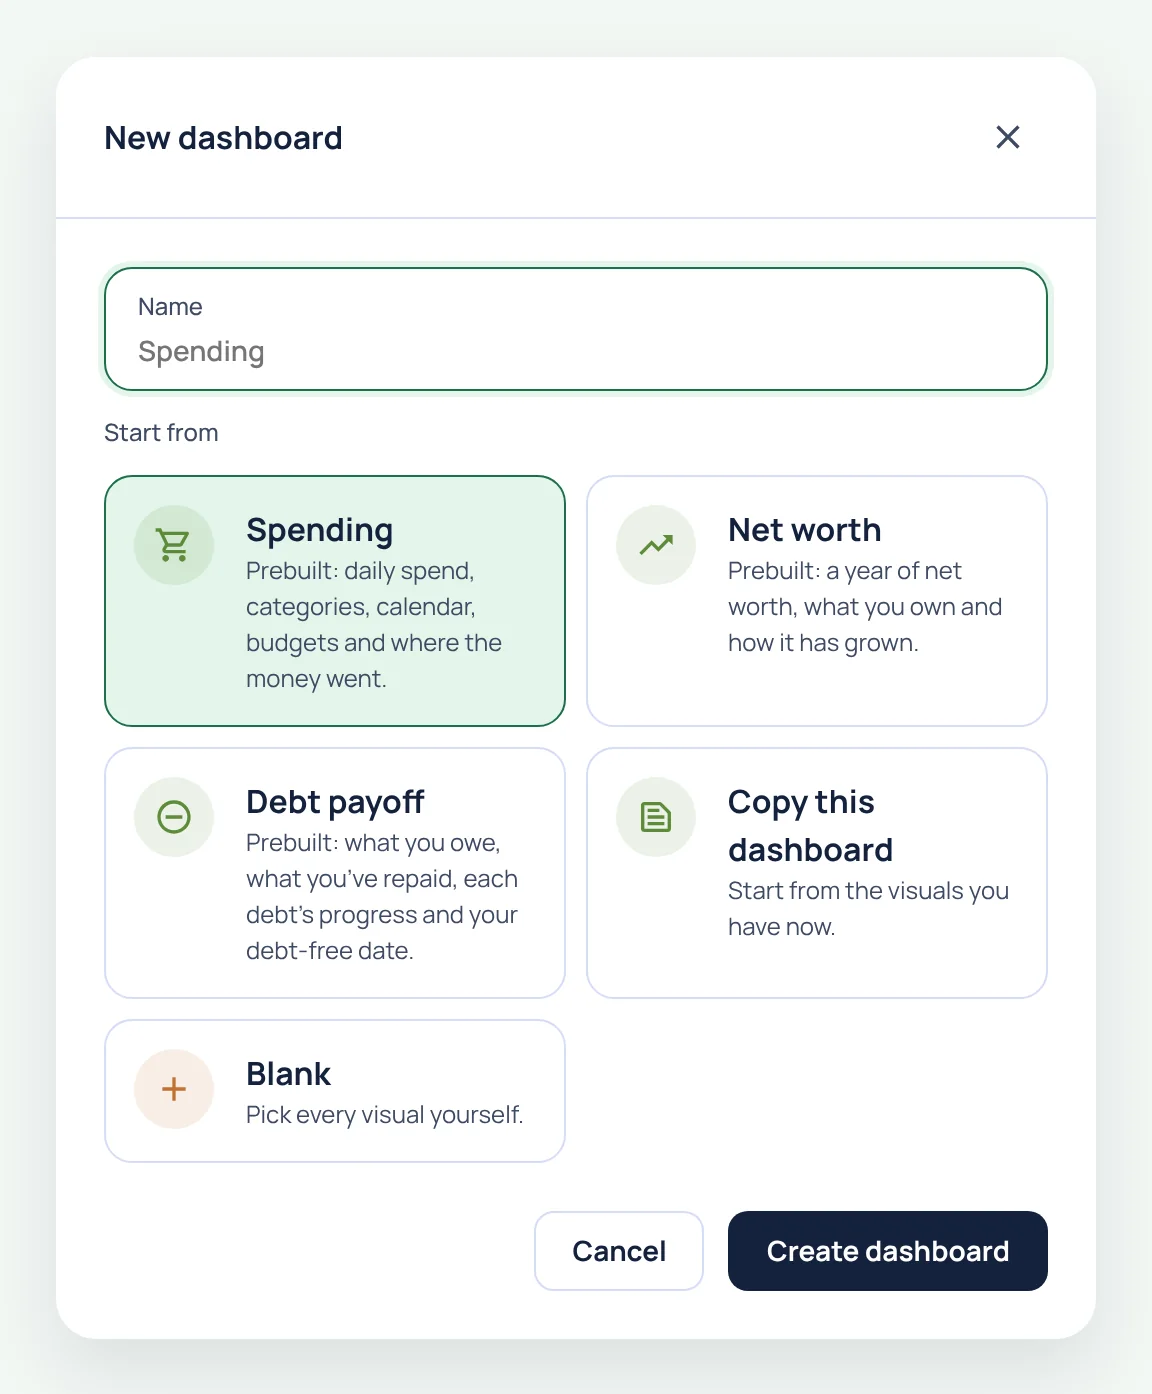
- Give it a name, or leave it blank to use the template's name.
- Under Start from, choose a ready-made dashboard or start fresh:
- Spending: daily spend, categories, a calendar, your budgets and where the money went.
- Net worth: a year of net worth, what you own and how it's grown.
- Debt payoff: what you owe, what you've repaid, each debt's progress and your debt-free date.
- Copy this dashboard: start from the visuals you have now.
- Blank: pick every visual yourself.
- Press Create dashboard. It opens straight away, and you can customise it like any other.
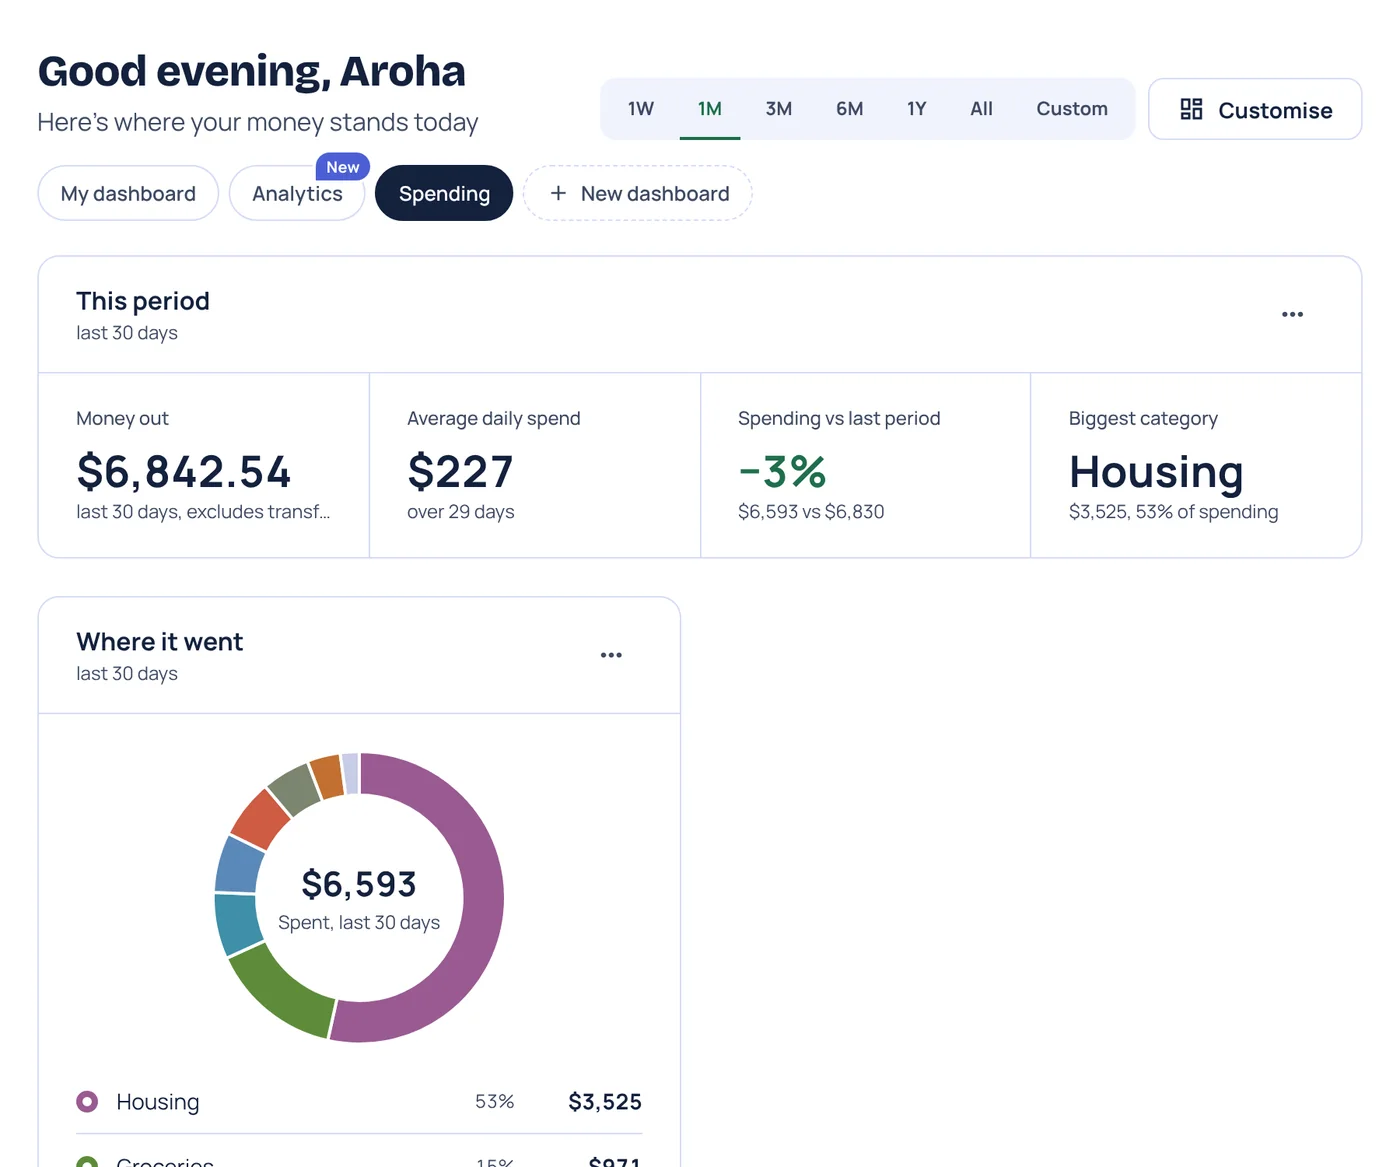
Switch between dashboards with the tabs under the greeting. You'll also find an Analytics dashboard there, which filters every visual at once by account, category or merchant.
Some ideas for dashboards that work well side by side:
- This fortnight: budgets, upcoming bills, a calendar and spending since payday.
- The long game: net worth, KiwiSaver, investments and your goals.
- The house: your property, home loan and deposit goal side by side.
- Debt-free: the Debt payoff template, plus a goal for the date you're aiming for.
Seedling includes one dashboard of your own. Sprout adds the prebuilt Spending and Net worth dashboards, Ripe lets you build 3 of your own, and Harvest as many as you like. During the private beta, everything is included.
Worthberry tracks your money. It doesn't give financial advice.